we create infographic for the future winners !
reaching new audience
high engagement content
suitable for your blog , social platoforms even if for your printings
backlink to boost your SEO
multiple formats (graphic, html5, gif , video)
Like prices in all markets in the world, house prices are constantly changing. House prices change due to fluctuations in demand or house stocks. Bank’s interest rates for Mortgage, the investments to be used in the Real-Estate market, rental prices and other funding opportunities mainly related to the country’s macroeconomic status and wealth are other factors that affect the market. This change generally follows an upward trend. There are some countries that draw attention in this increase and try to control it.
For example, since house prices in New Zealand increased by 43.8% in five years between the end of 2013 and 2018, the country banned foreigners from selling houses in order to control the rapidly increasing housing use at the beginning of 2018.
There are countries where prices increased by more than 50%.As we can see in the infographic, house prices in Colombia increased by 44.9% between Q42013 and Q42019. However, in some countries, the increases exceeded 50% in five years. For example, there was an increase of 53.7% in Hungary and 54.3% in India. Also in some countries, an increase of 60% was observed. The increase for Iceland and Ireland is around 62-66%.
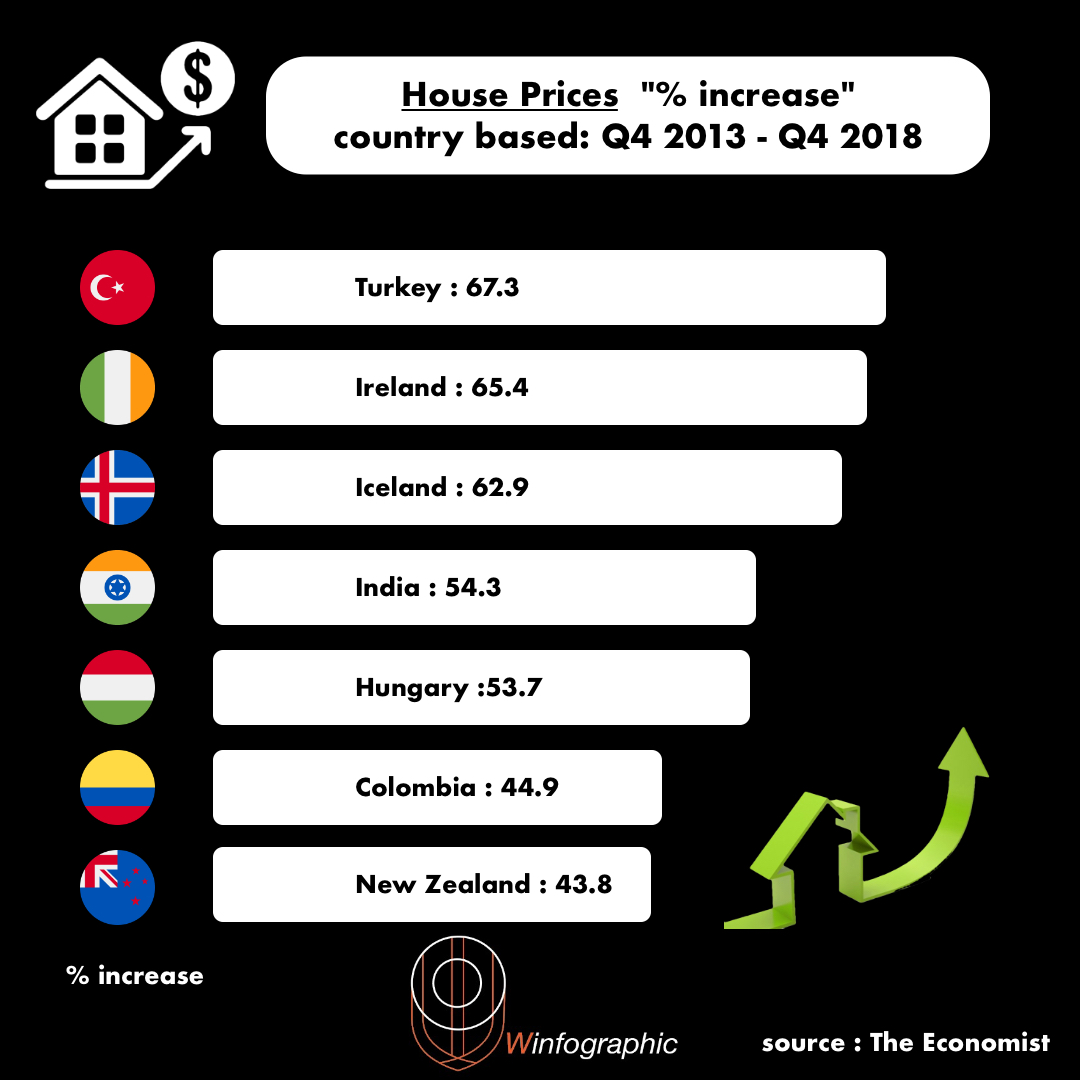
Turkey ranks at the top in house prices change with an increase of 67.3%. This fluctuation is mainly related to factors changes in macroeconomic circumstances in the country. Economic environment is capable of determining conditions in the real-estate market by affecting material costs used in the construction, interest rates and investment capacity.
According to the data we collected from The Economist, we have prepared these infographics.
Infographics are graphic visual representations of information, data or knowledge intended to present information quickly and clearly. They can improve cognition by utilizing graphics to enhance the human visual system’s ability to see patterns and trends. (Source: Wikipedia)
We will continue to prepare more infographics for you.